The world’s oceans are accumulating microplastics faster than we are building the knowledge needed to track them. That is the uncomfortable pattern in the NOAA NCEI Global Marine Microplastics Harmonized Database, which I analyzed: 29,076 observations spanning April 1972 to April 2026, drawn from every ocean basin. Within the most method-comparable subset of that record, median surface concentrations have risen roughly eighty-fold since the 2000s, yet 94% of all observations sit in the Northern Hemisphere, and the last eight years of “growth” in the database reflect a citizen-science beach survey rather than more open-ocean research.
TL;DR: Concentrations of surface microplastics in towed-net samples rose from about 0.002 pieces per cubic metre in the 2000s to 0.18 in the 2020s; sampling remains overwhelmingly concentrated in the Northern Hemisphere; and raw record counts after 2018 mostly measure a volunteer nurdle-survey program, not ocean conditions. The full analysis script, data, and charts are on GitHub.
What the data actually is
The NOAA NCEI harmonized database (NCEI Accession 0306475) is the largest openly available compilation of marine microplastic observations, updated quarterly and documented in Scientific Data. Each record is one measurement: where, when, what medium (ocean water, beach, sediment, or a nurdle survey), what method, and a concentration. Two properties shape everything that follows.
First, it is presence-only data. A record means a sample was taken and plastic was counted; an area with no records may be pristine or simply unobserved. Second, the three units in the collection (pieces per cubic metre, pieces per 10 minutes of trawling, and pieces per kilogram of dry sediment) are not comparable, so any trend analysis must be restricted to one unit and, ideally, one family of methods.
The trend: flat, then a sharp rise
Restricting the analysis to ocean-water samples collected with towed nets (neuston, manta, plankton, bongo and AVANI nets, the same technique family across five decades) shows medians that barely moved between the 1970s and the 2000s: 0.003, 0.0043, 0.0043 and 0.0022 pieces per cubic metre. Then the 2010s median jumps to 0.114 and the 2020s to 0.181, a roughly eighty-fold increase over the 2000s median, based on between 45 and 4,642 records per decade (see the analysis).
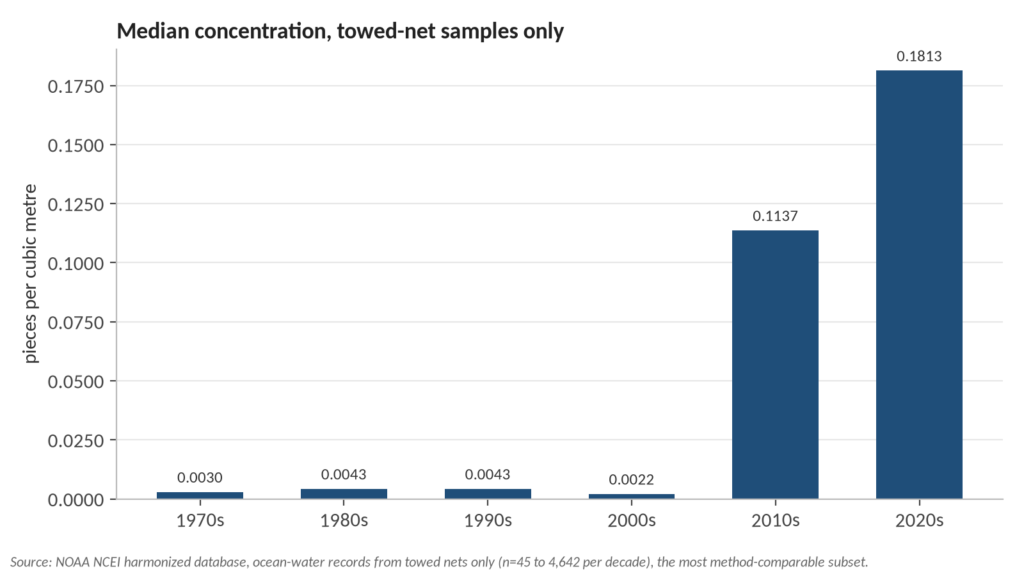
Honesty requires the caveat that this figure blends a real pollution signal with changes in how science looks: finer mesh sizes, more targeted expeditions into known accumulation zones, and better laboratory detection all push measured concentrations upward. But the direction is consistent with what production data predicts. Global plastics use was 460 million tonnes in 2019 and is projected to reach 1,231 million tonnes by 2060 according to the OECD, and models estimate rivers deliver roughly one million tonnes of plastic to the ocean each year, with more than 1,000 rivers responsible for 80% of that input (Meijer et al. 2021, Science Advances). The ocean had no trend toward less input at any point in this window.
Where scientists look, and where they don’t
Of 29,076 records, 94.1% sit north of the equator. The Southern Hemisphere’s share of annual observations peaked at about 13% in the 2010s and has fallen below 2% in the 2020s. The Indian Ocean, which borders some of the fastest-growing coastal populations on Earth, has 777 records. The Arctic has 386. The entire Southern Ocean, more than 20 million square kilometres, has 27.
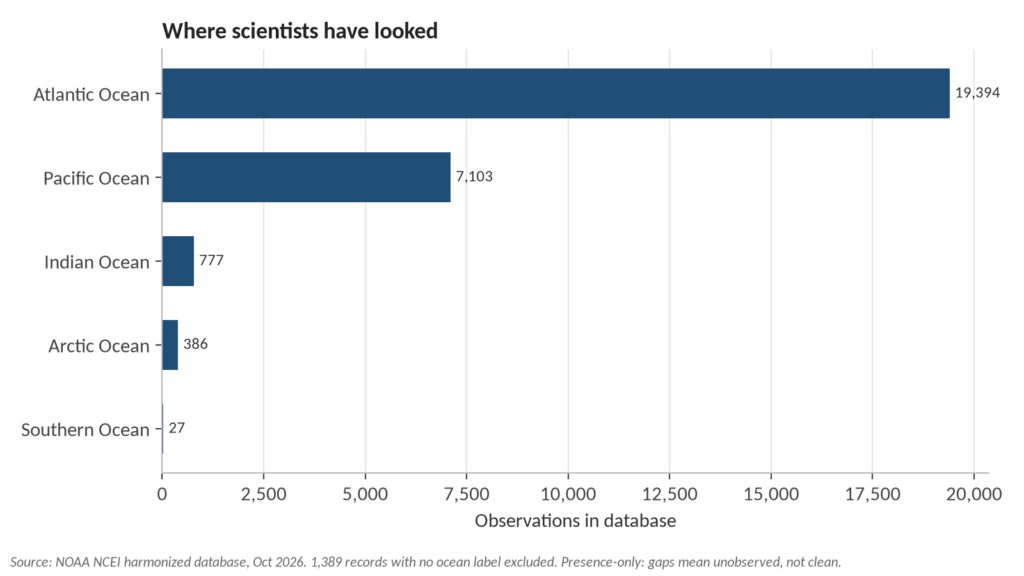
This is not a conspiracy, it is expedition economics: research vessels, funding calls and graduate students cluster in Europe, North America and East Asia. But its consequence is a knowledge gap that maps onto global inequality. The coastal communities most dependent on fishing and most exposed to unmanaged plastic waste are among the least-sampled on the planet, so when a region’s waters are finally studied, findings often surprise: hotspots emerge where none were measured. In this database the South China Sea shows the highest regional median (about 1,001 pieces per cubic metre, from a focused 115-record campaign), followed by the Celtic Sea and the Mediterranean, while the Caribbean’s median of zero across 1,805 records mostly reflects how few targeted campaigns looked there, not clean water.
The trap in rising bar charts
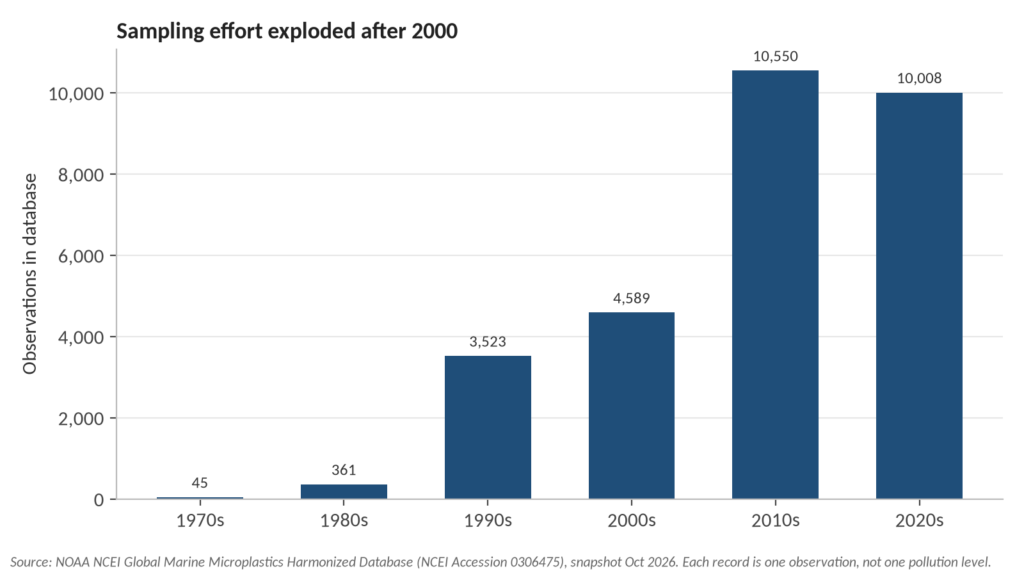
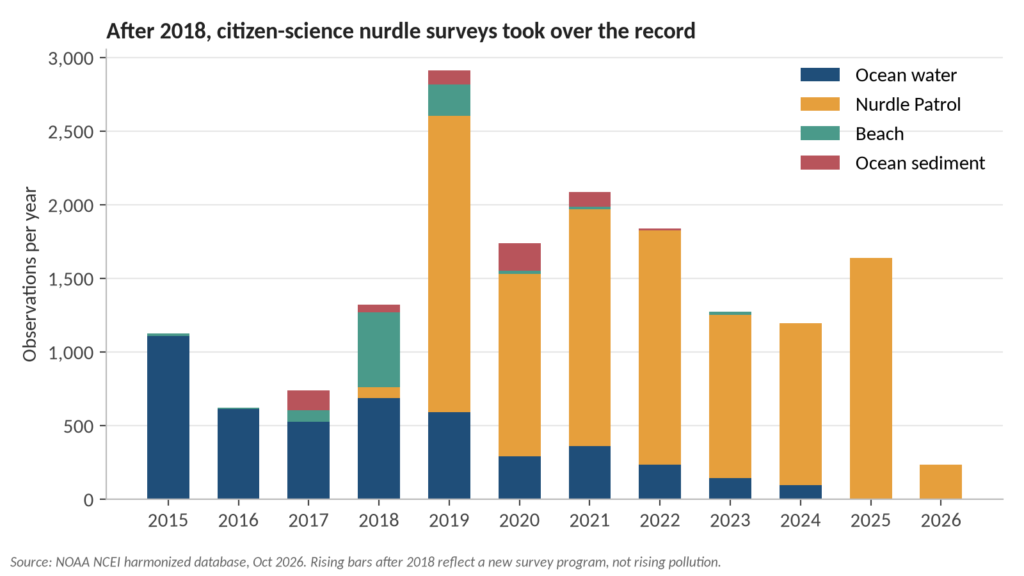
A naive chart of records per year shows apparent “growth” after 2018 that is entirely an artifact. From 2019 onward, more than half of all new records come from Nurdle Patrol, a citizen-science program that counts pre-production plastic pellets on beaches in ten-minute surveys, recorded in its own unit. Dedicated open-ocean water-column records, meanwhile, fall from over 1,100 in 2015 to zero in 2025 and 2026 so far. Anyone quoting the database’s rising record count as evidence of rising pollution is measuring the birth of a volunteer program. The reverse also matters: the disappearance of professional open-ocean sampling from the most recent years means the trend analysis above rests on an aging data stream.
Why this is a climate story
Microplastics are where the plastic crisis and the climate crisis physically meet. In the Arctic, sea ice acts as a conveyor and a time capsule: it traps particles as it forms and releases them as it melts, and melting ice is simultaneously opening the region to more shipping and fishing, themselves local sources of plastic debris (NOAA Arctic Report Card; Mountford et al. 2021). Researchers have measured concentrations exceeding 12,000 particles per litre in some Arctic sea ice (The Guardian, 2018), orders of magnitude above anything in this surface-water database, in a region with 386 records in fifty-four years. And the particles are not staying remote: a 2022 study detected plastic in the blood of 17 of 22 human donors (Leslie et al., Environment International).
Meanwhile the policy machinery is stalling. Talks toward a global plastics treaty collapsed in Geneva in August 2025 and, a year on, the process remains deadlocked, with the next real test not expected before late 2026 (Health Policy Watch, August 2026; World Economic Forum, August 2025). A treaty that cuts production upstream would address the cause; a data gap that keeps the least-sampled regions unmeasured would otherwise stay invisible while the problem compounds.
What the record itself argues for
Three things follow directly from this analysis. First, treat raw observation counts in any environmental database as evidence about observation, and decompose them by method, medium and unit before quoting them as trends. Second, the fastest way to close the knowledge gap is not new instrumentation but new sampling agreements that put research capacity in the hands of institutions in the Global South, whose waters the Southern Hemisphere gap leaves dark. Third, citizen science earns its place here: the nurdle surveys are genuine data, but they belong to their own unit and question, and mixing them into open-ocean trends corrupts both.
FAQ
Does this dataset show ocean plastic pollution is getting worse? Within the comparable towed-net subset, yes: median measured concentrations rose roughly eighty-fold from the 2000s to the 2020s. Part of that rise reflects better detection and targeted sampling, so the honest statement is that nothing in the record suggests a decline, and the measured signal points upward.
Why is the Southern Hemisphere so underrepresented? Research funding, vessel availability and academic networks concentrate in the Northern Hemisphere. The database mirrors that: 94% of records are north of the equator, and the Southern Hemisphere’s share of annual observations has fallen below 2% in the 2020s.
Can I reproduce this analysis? Yes. The dataset snapshot, the base-R script, and all summary tables are in the GitHub repository. The script needs no packages and runs in about a minute. Method summary: the dataset was split by medium and unit, and the trend reported here uses only ocean-water records in pieces per cubic metre collected with towed nets, aggregated as medians by decade; per-decade record counts in that subset run from 45 in the 1970s to 4,642 in the 2010s.
What are nurdles? Pre-production plastic pellets, the raw material of the plastics industry. They spill in transit and handling, accumulate on shorelines, and are the subject of the Nurdle Patrol citizen surveys that dominate the database’s recent records.
What would the global plastics treaty change? Negotiations aim at a legally binding instrument covering the plastic lifecycle, including marine environments, but talks collapsed in Geneva in August 2025 without agreement, and remain stalled as of late 2026. Without upstream production cuts, models project plastics use tripling by 2060 (OECD Global Plastics Outlook, 2022).
Reproducibility. The dataset snapshot, the base-R analysis script, and all summary tables are in the GitHub repository. Analysis and writing: Qanit Takmeel.