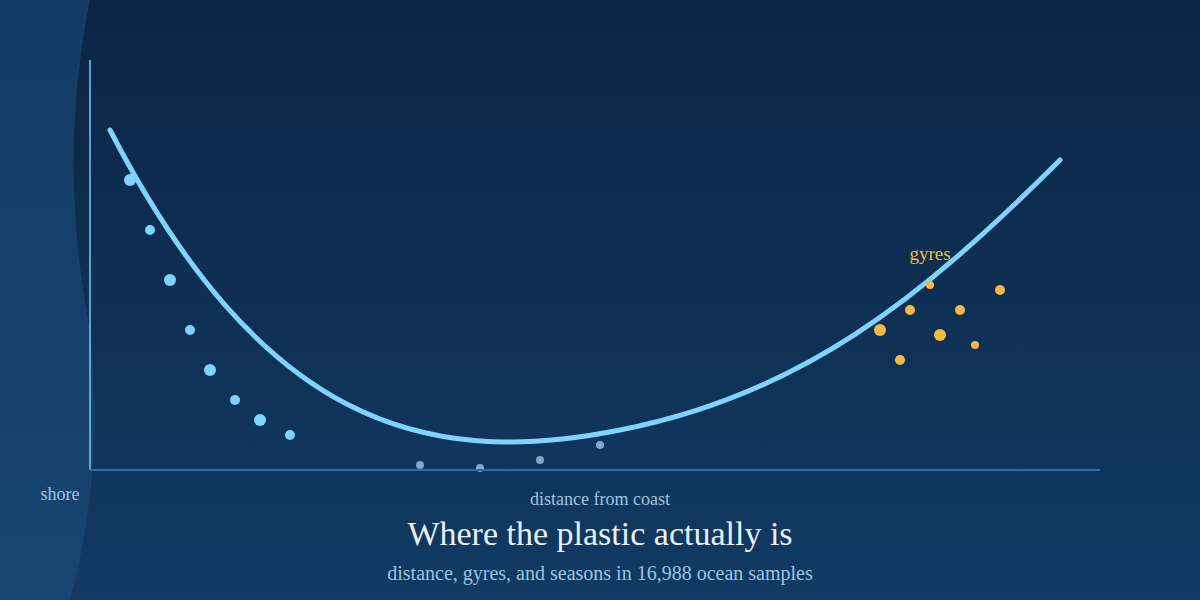
TL;DR: Analyzing the 16,988 ocean-water records in NOAA’s harmonized marine microplastics database, we find three things. First, concentration falls roughly tenfold over the first 100 km from shore and then climbs again far offshore, a U-shaped curve whose far end is the subtropical gyres. Second, of the five subtropical gyres, three measure genuinely higher than the rest of the ocean (South Atlantic 15.9x, Indian 12.2x, North Atlantic 1.9x) while the famous North Pacific “garbage patch” measures 0.6x, lower than outside, and the two most-studied gyres are oversampled 2-3x relative to their share of ocean area. Third, sampling effort is almost perfectly balanced across seasons, but measured concentration is 8.3x higher in summer than winter, a signal that tracks where cruises go, not when plastic accumulates.
The short answer
Distance, gyres, and seasons are the three axes along which people usually describe ocean plastic: it washes off land, it collects in the gyres, and it is measured when someone goes out to look. This post tests each of those three ideas against the same dataset, the NOAA NCEI Marine Microplastics database [1], a harmonized collection of field measurements from 1972 to the present described in Scientific Data in 2023 [2]. Here we ask what the measurements say once you weight them by where and when they were taken.
The three answers, in one line each: the decay curve from shore is real but U-shaped, not exponential; the gyres measure higher, except the one everyone has heard of; and the seasonal signal in the data is a map of research cruises rather than a calendar of plastic. This post builds on the previous post in the series, which asked who does the measuring.
What I analyzed
The harmonized database (NCEI Accession 0306475) holds 29,076 records, but they mix three units that cannot be compared: water concentrations in pieces per cubic meter, sediment in pieces per kilogram, and beach nurdle counts in pieces per ten minutes. I therefore restricted every analysis below to the 16,988 ocean-water records, the only subset with a common volumetric unit. These come from neuston nets, manta trawls, pumps and bucket grabs spread across all five oceans, dated April 1972 to April 2026, with a median sample taken 133 km from the nearest coastline and the farthest 2,497 km out.
Distance from shore was computed as the great-circle distance from each record to the nearest vertex of a global coastline (~78,000 points), gyres were defined as 2,500 km-radius disks centered on the five subtropical gyres, and seasons were assigned meteorologically with hemisphere adjustment, so that July counts as summer in the north and winter in the south. All code is in the repository and listed at the end.
Question 1: Does concentration decay with distance from shore?
Yes, sharply, and then it reverses. Binned by distance from the nearest coastline, median concentration falls from 0.042 pieces/m3 within 10 km of shore to 0.022 at 10-25 km, 0.0065 at 25-50 km, and 0.0043 at 50-100 km: a tenfold drop over the first hundred kilometers. A log-log fit over that near-shore range gives a slope of -0.51. If the story stopped there, the ocean beyond 100 km would be an order of magnitude cleaner than the coastal margin.
It does not stop there. From 100 km outward the medians turn and climb: 0.0066 at 100-200 km, 0.011 at 200-400 km, 0.017 at 400-800 km, and 0.036 beyond 1,600 km, which is nearly back to the coastal median. The curve is a U, not an exponential decay.
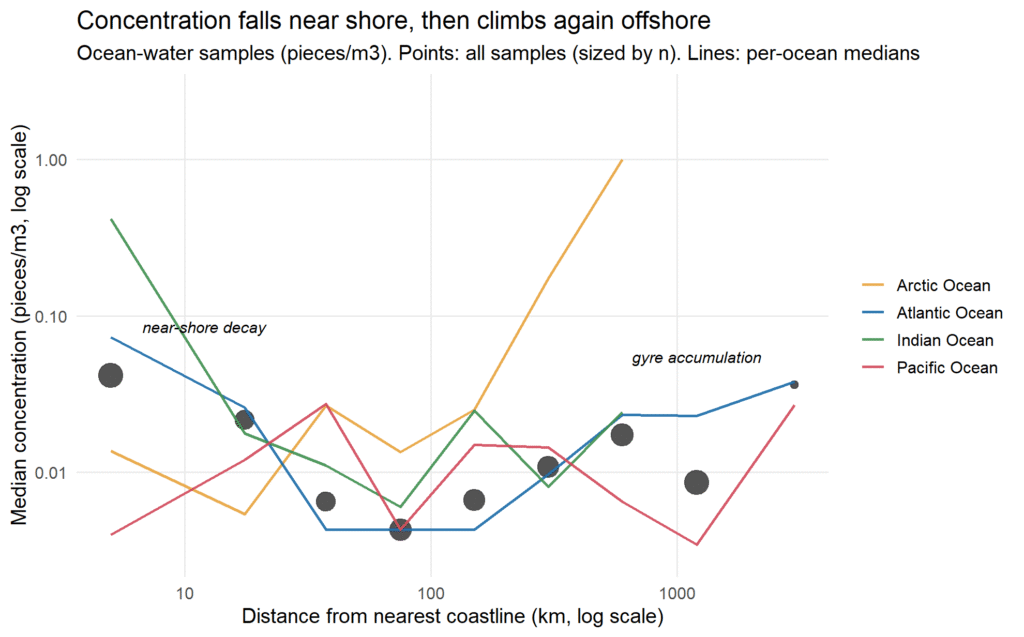
The per-ocean curves in the figure explain why. The Atlantic shows the textbook pattern, decaying from 0.073 near shore to 0.0043 at 50-100 km and climbing back to 0.038 beyond 1,600 km. The Indian Ocean starts extremely high at the coast (0.42 pieces/m3) and decays steeply. The Pacific shows almost no near-shore decay at all, because its coastal samples are already low and its offshore samples rise. The Arctic is the outlier: its median increases with distance from shore, reaching 1.0 pieces/m3 at 400-800 km offshore. That is consistent with what dedicated Arctic studies have found, that sea ice concentrates microplastics by orders of magnitude over surrounding water as it forms and drifts [6], so the far-from-shore Arctic is not a clean baseline but a trap.
The likely reading of the U is that two mechanisms stack: dilution with distance from the coastal sources, and accumulation wherever surface convergence gathers floating debris. The far-offshore rise is not noise; it is the gyres. Which raises the second question.
Question 2: Do the gyres really measure higher, or only get sampled more?
Both, but not for the same gyres. I marked each record inside or outside a 2,500 km disk around each of the five subtropical gyres, the accumulation zones that ocean circulation models and surveys have predicted and confirmed for decades [4][5][3]. Each disk covers about 5.4% of the global ocean, so if sampling were geographically blind, 5.4% of records would fall in each.
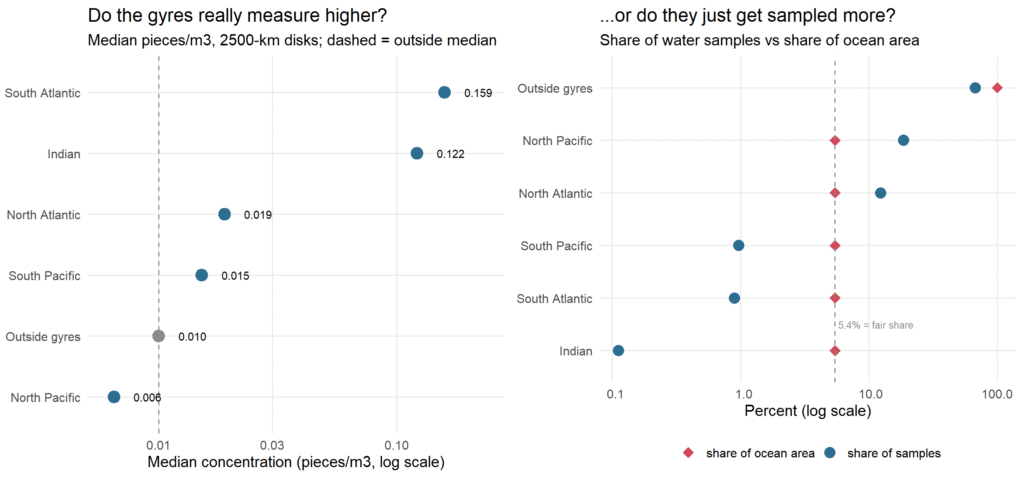
The concentration answer is split. The South Atlantic gyre measures 15.9x the outside median (0.159 vs 0.010 pieces/m3, Mann-Whitney p = 1.3e-13) and the Indian gyre 12.2x (0.122, p = 3.8e-4), though the Indian disk holds only 19 records and should be read as a hint. The North Atlantic gyre, the best-studied accumulation zone in the literature [5], measures 1.9x outside (0.019, p = 1.4e-7) on 2,092 records. The South Pacific shows no significant difference (1.5x, p = 0.47).
The North Pacific is the surprise: the disk containing the Great Pacific Garbage Patch measures 0.6x the outside median (0.0065 vs 0.010, p = 0.004) on 3,145 records, the largest gyre sample in the database. Lower, not higher, and significantly so. This is less paradoxical than it looks. The garbage patch is famous as a surface-area phenomenon, quantified in pieces per square kilometer of sea surface [3]; per cubic meter of filtered water, a diffuse convergence zone does not need to beat a coastal average that includes river plumes and harbor samples. Volumetric concentration and debris density are different claims, and the database mostly records the first.
The effort answer is not split at all. The North Pacific disk holds 18.5% of all ocean-water records, 3.4 times its fair area share, and the North Atlantic holds 12.3%, 2.3 times its share. The South Atlantic holds 0.9% and the Indian 0.1% of records, despite measuring the highest concentrations. The gyres we talk about most are the ones we sample most, and the gyres that measure highest are nearly unsampled. That inversion is worth sitting with: the most-cited number in ocean plastic, the 5.25 trillion floating pieces estimated by Eriksen and colleagues in 2014 [3], leans on exactly this uneven sampling base.
Question 3: Is sampling biased toward summer, and does concentration vary by season?
The effort half of the question has a clear answer: no. Hemisphere-adjusted, the database holds 4,161 summer records and 4,154 winter records, and the monthly counts run from 854 (September) to 1,998 (December) without a summer spike. Whatever drives when samples get taken, it is not beach weather.
The concentration half has a striking answer: yes, enormously. Median measured concentration is 0.036 pieces/m3 in summer, 0.016 in fall, 0.011 in spring, and 0.0043 in winter, an 8.3x summer-to-winter ratio (Kruskal-Wallis p < 2.2e-16).
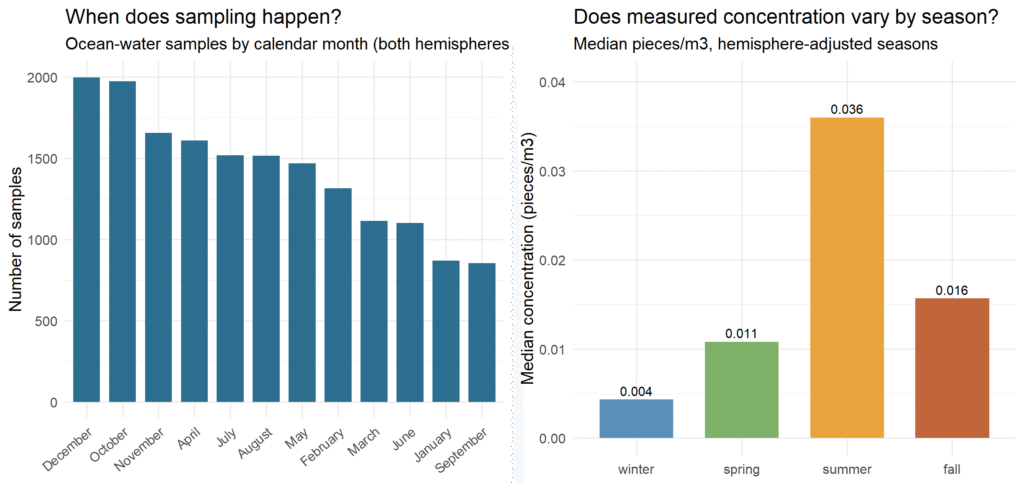
I would not defend that as seasonality of plastic. The most likely mechanism is compositional: summer is when research vessels reach the Arctic and when gyre-focused cruises sail, so the summer record mix is weighted toward the high-concentration offshore stations that Questions 1 and 2 identified, while winter sampling skews toward low-concentration coastal waters. Season here is a proxy for destination. The right conclusion is not that the ocean has 8x more plastic in July, but that in this database, the calendar tells you where the ship went.
Caveats
Three limitations bound all of this. Coastline distance comes from the maps package’s global coastline, so near-shore distances carry a few kilometers of slop, though nothing that could move a bin boundary at 10, 25, 50 or 100 km by much. The gyre disks are circles of fixed radius around nominal centers, which is a blunt instrument for features whose real boundaries are dynamic convergence zones; the North Pacific result in particular should be read as “the region around 30N, 140W,” not a precise delineation of the garbage patch. And the database harmonizes heterogeneous methods with different mesh sizes and detection limits, so cross-study medians mix gears; every comparison above is between pooled distributions, not between calibrated instruments.
How to reproduce it
Everything runs in R on the public database download from NCEI [1]. Two scripts in the NOAA-microplastics repository on GitHub carry this post: 02_distance.R computes great-circle distance to the nearest coastline vertex for every ocean-water record, and 03_analysis.R runs the binned decay curves, the gyre assignment and Mann-Whitney tests, and the hemisphere-adjusted seasonality, regenerating all three figures.
Qanit Takmeel is a materials science engineer who enjoys analyzing publicly available datasets in R. The code behind every number in this series is at github.com/qtakmeel/NOAA-microplastics.
FAQ
Does microplastic concentration really decay with distance from shore? Near shore, yes: median concentration falls about tenfold over the first 100 km (0.042 to 0.0043 pieces/m3 in this database). But the curve is U-shaped, not monotone: beyond 100 km it climbs again, reaching 0.036 pieces/m3 past 1,600 km, because the subtropical gyres accumulate floating plastic far from land.
Do the five subtropical gyres measure higher than the rest of the ocean? Three of five do in this database: South Atlantic 15.9x the outside median, Indian 12.2x (on only 19 records), North Atlantic 1.9x. The North Pacific garbage-patch region measures 0.6x, significantly lower per cubic meter, because the patch is a surface-area phenomenon (pieces per km2) rather than a volumetric one.
Is ocean plastic sampling biased toward summer? Not in this database: hemisphere-adjusted season counts are nearly equal (4,161 summer vs 4,154 winter records). What varies is concentration: summer medians are 8.3x winter medians, most plausibly because summer cruises target the high-concentration gyres and Arctic, so season acts as a proxy for sampling location.
Can I reproduce this analysis? Yes. The NOAA NCEI database is a public CSV download, and the two R scripts (02_distance.R, 03_analysis.R) in the GitHub repository regenerate every number and figure in this post from it.
References
[1] NOAA NCEI, Marine Microplastics database and map portal, accessed November 2026.
[2] The NOAA NCEI marine microplastics database, Scientific Data 10 (2023).
[3] Eriksen, M. et al., Plastic Pollution in the World’s Oceans: More than 5 Trillion Plastic Pieces Weighing over 250,000 Tons Afloat at Sea, PLOS ONE 9(12), e111913 (2014).
[4] Cozar, A. et al., Plastic debris in the open ocean, PNAS 111(28), 10239-10244 (2014).
[5] Law, K. L. et al., Plastic Accumulation in the North Atlantic Subtropical Gyre, Science 329, 1185-1188 (2010).
[6] Peeken, I. et al., Arctic sea ice is an important temporal sink and means of transport for microplastic, Nature Communications 9, 1505 (2018).
Leave a Reply